The use S-Curve in Construction Projects

Tracking the progress of construction projects, in this case will be building construction requires a lot of attention in terms of quality, cost, and time. One of the software used to track the construction progress is Microsoft Project (MSP). I will discuss about the use of S-curve as visual aid to track work progress for construction project based on earned value method using MSP.
MSP is one of the most use project management tools to track work progress. By using the earned value analysis built in this software, project managers can observe the budgeted cost works scheduled (BCWS also called as planned value), budgeted cost works performed (BCWP also called as earned value), actual cost works performed (ACWP), cost performance index (CPI), and schedule performance index (SPI) in one page.
With the baseline being set up, MSP is able to generate s-curve based on the value from the earned value page. MSP 2003 can generate s-curve based on cost and with this construction projects can make use of this feature. MSP 2007 however based on findings, cannot generate s-curve based on cost, but can only be generated based on rate assigned from the resources.
Project Management Books

Which Project Management Tools do you Prefer?
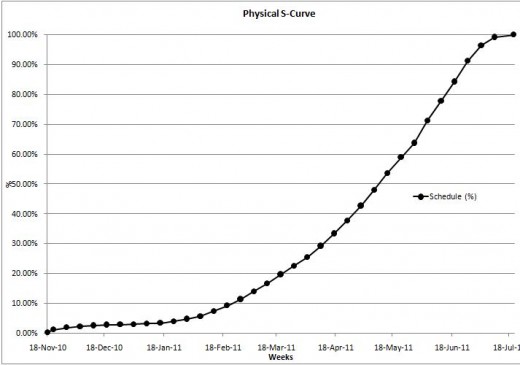
S-curve is actually a time scaled graph based on the value from the planned value, earned value and the actual cost. It is called S-curve because of the “s” like shape of the graph. With s-curve, clients can observe the progress of the project. If the project is delay, the earned value will be below the planned value, whereas if the project is ahead of schedule, earned value will be above the planned value. Actual value is to track the budget of the project. The project will be underbudget if it is below the planned value and vice versa.
A projection curve can be done from the s-curve to know the project completion date and the status of the budget. However, it is more accurate to project it using CPI and SPI. CPI is the actual cost divided by the planned value and SPI is the earned value divided by the planned value.
SPI
| Status
|
|---|---|
Equal to 1
| On Schedule
|
More than 1
| Ahead of Schedule
|
Less than 1
| Delay
|
CPI
| Status
|
|---|---|
Equal to 1
| On Budget
|
More than 1
| Under Budget
|
Less than 1
| Over Budget
|
By integrating the s-curve and the performance indexes to one report, clients will understand the overall progress of the construction project.


